使用 Grafana、collectd 和 InfluxDB 打造现代监控系统
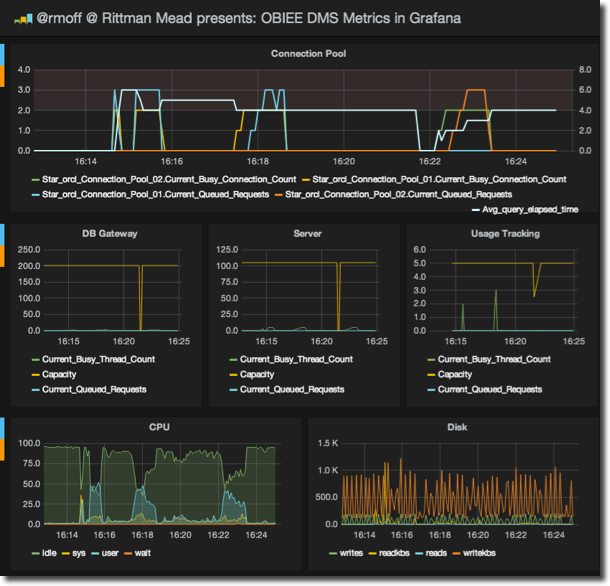
想打造 New Relic 那样漂亮的实时监控系统我们只需要 InfluxDB/collectd/Grafana 这三个工具,这三个工具的关系是这样的:
采集数据(collectd)-> 存储数据(InfluxDB) -> 显示数据(Grafana)。
- InfluxDB 是 Go 语言开发的一个开源分布式时序数据库,非常适合存储指标、事件、分析等数据,看版本号(v0.8.8)就知道这个项目还很年轻;
- collectd 就不用介绍了吧,C 语言写的一个系统性能采集工具;
- Grafana 是纯 Javascript 开发的前端工具,用于访问 InfluxDB,自定义报表、显示图表等。
下面的安装和配置步骤在 Ubuntu 14.04 Server 64bit 版上完成。升级整个系统后重启:
$ sudo apt-get update
$ sudo apt-get upgrade
$ sudo reboot
安装 InfluxDB
InfluxDB 是 Go 写的,不依赖任何其他包或库,很干净。安装很容易:
$ wget https://s3.amazonaws.com/influxdb/influxdb_latest_amd64.deb
$ sudo dpkg -i influxdb_latest_amd64.deb
启动 InfluxDB:
$ sudo /etc/init.d/influxdb start
Setting ulimit -n 65536
Starting the process influxdb [ OK ]
influxdb process was started [ OK ]
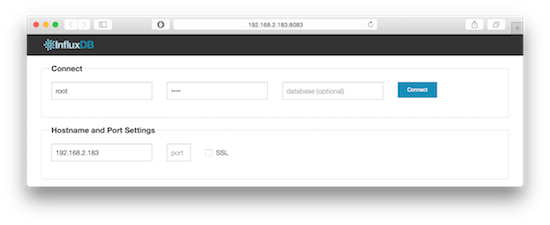
启动后打开 web 管理界面 http://192.168.2.183:8083/ 默认用户名和密码是 root 和 root. InfluxDB 的 Web 管理界面端口是 8083,HTTP API 监听端口是 8086,如果需要更改这些默认设定,修改 InfluxDB 的配置文件 /opt/influxdb/current/config.toml 后重启 InfluxDB 就可以了。
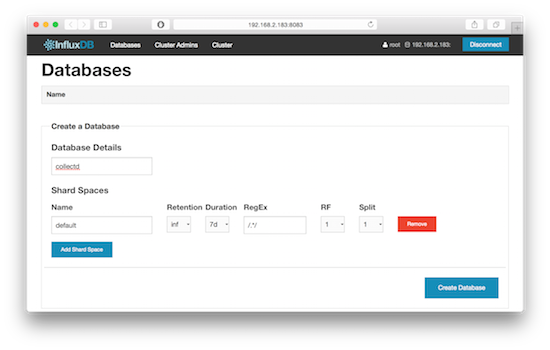
在刚安装好的 InfluxDB 上创建一个名为 collectd 的数据库,可以用命令行创建,也可以用 Web 管理界面操作:
$ curl "http://192.168.2.183:8086/db?u=root&p=root" -d "{\"name\": \"collectd\"}"
安装 collectd
安装 collectd:
$ sudo apt-get install collectd
配置 collectd 为客户端,收集到数据后直接发给 InfluxDB:
$ sudo vi /etc/collectd/collectd.conf
...
LoadPlugin network
...
<Plugin network>
        Server "192.168.2.183" "25826"
</Plugin>
...
重启 collectd:
$ sudo /etc/init.d/collectd restart
InfluxDB 现在自带一个 collectd 插件来获取 collectd 客户端发来的数据,以前可没这么方便哦,0.8.4 版本以前只能通过 influxdb-collectd-proxy 这样的第三方程序来连接 collectd 和 InfluxDB. 如果你检查一下服务器上打开的端口就会发现 influxdb 插件启动了一个 25826 端口,如果发现 InfluxDB 数据库里没有(收集到)数据,务必检查这个 25826 端口是否正常启动了:
$ sudo netstat -tupln
Active Internet connections (only servers)
Proto Recv-Q Send-Q Local Address           Foreign Address         State       PID/Program name
tcp        0      0 0.0.0.0:22              0.0.0.0:*               LISTEN      622/sshd
tcp6       0      0 :::8086                 :::*                    LISTEN      668/influxdb
tcp6       0      0 :::22                   :::*                    LISTEN      622/sshd
tcp6       0      0 :::8090                 :::*                    LISTEN      668/influxdb
tcp6       0      0 :::8099                 :::*                    LISTEN      668/influxdb
tcp6       0      0 :::8083                 :::*                    LISTEN      668/influxdb
udp6       0      0 :::25826                :::*                                668/influxdb
InfluxDB 自带的 collectd 插件默认是关闭的,需要手动配置打开 enabled = true,并填上 database = “collectd” 这一行,这里的 “collectd” 就是我们上面创建的那个数据库,更改配置后记得重启 InfluxDB:
$ sudo vi /opt/influxdb/current/config.toml
$ sudo vi /opt/influxdb/shared/config.toml
...
  # Configure the collectd api
  [input_plugins.collectd]
  enabled = true
  # address = "0.0.0.0" # If not set, is actually set to bind-address.
  # port = 25826
  database = "collectd"
  # types.db can be found in a collectd installation or on github:
  # https://github.com/collectd/collectd/blob/master/src/types.db
  # typesdb = "/usr/share/collectd/types.db" # The path to the collectd types.db file
...

$ sudo /etc/init.d/influxdb restart
Setting ulimit -n 65536
Setting ulimit -n 65536
influxdb process was stopped [ OK ]
Setting ulimit -n 65536
Starting the process influxdb [ OK ]
influxdb process was started [ OK ]
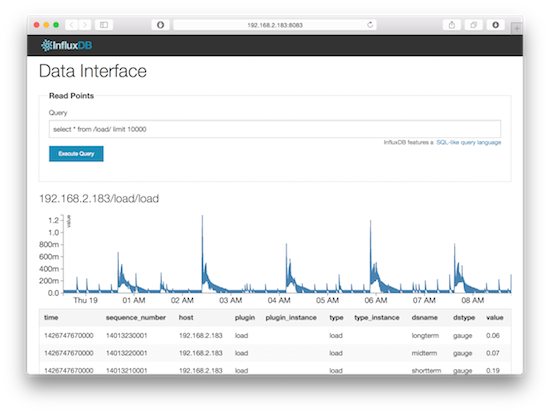
现在 InfluxDB 已经准备好接受和处理 collectd 传来的数据了。用命令行或者 Web 管理界面验证一下数据库里是否有数据:
$ curl -G 'http://192.168.2.183:8086/db/collectd/series?u=root&p=root&q=list+series&pretty=true'
[
    {
        "name": "list_series_result",
        "columns": [
            "time",
            "name"
        ],
        "points": [
            [
                0,
                "192.168.2.183/cpu-0/cpu-idle"
            ],
...
        ]
    }
]
安装 Grafana
下载 grafana 后解压放到 web 服务器上就可用。这里省去配置 Nginx/Apache 之类的麻烦,直接用最简单的 Web 服务器 python -m SimpleHTTPServer 驱动:
$ wget http://grafanarel.s3.amazonaws.com/grafana-1.9.1.tar.gz
$ tar xzvf grafana-1.9.1.tar.gz
$ cd grafana-1.9.1.tar.gz
$ cp config.sample.js config.js

$ vi config.js
...
      // InfluxDB example setup (the InfluxDB databases specified need to exist)
      datasources: {
        influxdb: {
          type: 'influxdb',
          url: "http://192.168.2.183:8086/db/collectd",
          username: 'root',
          password: 'root',
        },
        ...
      },
...

$ sudo python -m SimpleHTTPServer
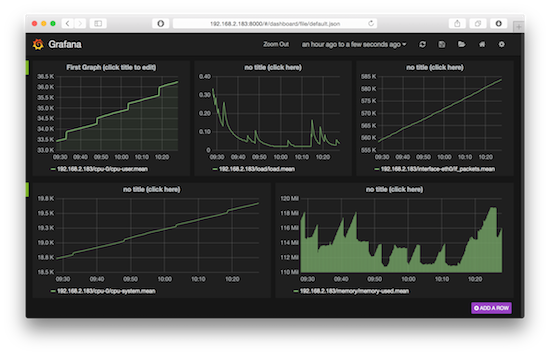
用浏览器访问 Grafana,这里的默认端口是 8000:

- 来自北京的 Firefox 52.0|Windows 10 用户 2017-04-08 16:44 9 赞
- 反正我喜欢redhat。。。。。。。。。。。。。。。。。。。。。。单纯觉得图标很好看,红帽子
- [1]来自 - 浙江杭州 的 Chrome/Mac 用户 发表于 2015-06-24 09:30 的评论:/opt/influxdb/current/config.toml 为什么没有找到这个文件
- 来自浙江杭州的 Chrome 43.0|Windows 7 用户 2015-09-16 15:13 3 赞
- /etc/opt
- [1]丶嘿嘿 发表于 2015-04-14 20:08 的评论:端口25826 没有起来[2]来自 - 江苏南京 的 Firefox/Linux 用户 发表于 2015-04-15 09:18 的评论:同样问题,有解决吗?
- 丶嘿嘿 2015-05-11 16:11 12 赞
- 解决了,是iptables的问题,关掉就可以了
- [1]LinuxSQL 发表于 2015-04-16 09:53 的评论:我很有疑问的是,为什么都要以Ubuntu系统为例,难道现在企业都是用Ubuntu系统作为服务器系统?[2]朩ダo○ 发表于 2015-04-17 10:04 的评论:嗯,本文中没有哪里说明是以Ubuntu系统为例的哇?apt-get是任何debian系的系统都有的,不能依此判断就是Ubuntu,另外登录的管理页面时有用的是mac,就更加难以判断具体是哪种系统咯。另外,Ubuntu的确也是个很不错的发行版哦[3]linux 发表于 2015-04-17 15:09 的评论:一般来说,应该是 Ubuntu。说实话,我是 RedHat 粉,所以不是特别喜欢用 Ubuntu,尤其是服务器方面。但是国外的 Linux 技术文章,非常多的都用 Ubuntu,我个人估计得有90%。确实也不太理解,我就不信国外的 Linux 使用场景,尤其是服务器端,Ubuntu 能有这么多的使用量。[4]朩ダo○ 发表于 2015-04-17 19:34 的评论:这个还是比较容易解释的,国外的这些作者,在公司的服务器上可能用的是其他发行版,不过些文章的时候,一般都回到家了嘛,在家的电脑上一般常常就安装Ubuntu咯,因为这个版本用的人比较多嘛,所以写文章看的人也多,交流也方便~\(≧▽≦)/~啦啦啦
- kashu 2015-04-19 10:45 12 赞
-
哈哈……看看一些一样或不一样的观点
.
服务器操作系统应该选择 Debian/Ubuntu 还是 CentOS?
http://www.zhihu.com/question/19599986
.
Linode 里为什么 Ubuntu 最火呢?
http://www.zhihu.com/question/21421588
- [1]LinuxSQL 发表于 2015-04-16 09:53 的评论:我很有疑问的是,为什么都要以Ubuntu系统为例,难道现在企业都是用Ubuntu系统作为服务器系统?[2]来自 - 北京 的 Firefox/Linux 用户 发表于 2015-04-17 10:17 的评论:国内大量使用红帽系统,是先入为主的原因,其实UBUNTU性能也是不错的
- linux 2015-04-17 15:06 1 赞
-
1、我没有做过 Ubuntu 和 Centos 的性能比较,但是我以为,就通用情况而言,不会差异很大。所以性能不是选择 CentOS 的原因。
2、Ubuntu,或者说 Debian 系,做服务器的也有不少长处,比如安全性方面,也颇有特色。
3、CentOS 在企业级的支持上好一些,这方面,有篇文章可以看看 http://linux.cn/article-3538-1.html
4、Ubuntu Server ,是我见过启动后进程数量最少的一种 Linux 发行版,大概5个左右。
5、国内很多人确实一开始就接触 RedHat,这个会影响之后的选择和好恶。
- [1]丶嘿嘿 发表于 2015-04-14 20:08 的评论:端口25826 没有起来
- 来自 - 北京 的 Firefox/Windows 用户 2015-04-17 10:00 2 赞
- 同样问题
- [1]LinuxSQL 发表于 2015-04-16 09:53 的评论:我很有疑问的是,为什么都要以Ubuntu系统为例,难道现在企业都是用Ubuntu系统作为服务器系统?
- Liuyibao 2015-04-17 09:24 2 赞
- ubuntu挺好用啊,做服务器也挺好
- [1]丶嘿嘿 发表于 2015-04-14 20:08 的评论:端口25826 没有起来[2]来自 - 江苏南京 的 Firefox/Linux 用户 发表于 2015-04-15 09:18 的评论:同样问题,有解决吗?[3]轩尼斯 发表于 2015-04-15 15:30 的评论:同样问题,解决了的话说一下,谢谢
- 来自 - LAN 的 Chrome/Windows 用户 2015-04-15 17:25 2 赞
- 25826没有起来
- [1]netb2c 发表于 2015-04-14 09:46 的评论:在用了,数据实时同步更新,线型视图展示.不错__
- 来自 - 江苏南京 的 Firefox/Linux 用户 2015-04-15 11:15 2 赞
-
有遇到:端口25826 没有起来 这个问题吗?
谢谢啊。
- jbiaojerry 2015-04-14 15:48 2 赞
-
centos7安装collectd启动不起来,报这错,[root@localhost init.d]# systemctl status collectd.service
collectd.service - SYSV: Collectd is a statistics gathering daemon used to collect system information ie. cpu, memory, disk, network
Loaded: loaded (/etc/rc.d/init.d/collectd)
Active: failed (Result: resources) since 二 2015-04-14 15:43:24 CST; 2min 56s ago
Process: 5135 ExecStart=/etc/rc.d/init.d/collectd start (code=exited, status=0/SUCCESS)
4月 14 15:43:24 localhost.localdomain collectd[5135]: Starting collectd: not starting due to configuration error
4月 14 15:43:24 localhost.localdomain collectd[5135]: [6B blob data]
4月 14 15:43:24 localhost.localdomain systemd[1]: PID file /var/run/collectd.pid not readable (yet?) after start.
4月 14 15:43:24 localhost.localdomain systemd[1]: Failed to start SYSV: Collectd is a statistics gathering daemon used to collect syste...etwork.
4月 14 15:43:24 localhost.localdomain systemd[1]: Unit collectd.service entered failed state.
Hint: Some lines were ellipsized, use -l to show in full.
 );)